This week we are looking at Surveys and Statistics. We have looked at a large number of social media tools during this course, but regardless of which you use, it’s crucial to understand the effectiveness of your efforts.
Anyone who works in marketing will also tell you the importance of understanding your current and potential customers. Even if you are not a marketing specialist, most people realise that knowing as much as you can about your customers will help you make important business decisions.
Here is this week’s lesson plan (click for the pdf file)
ZSMS Module 09 Surveys and Statistics
Surveys
There are a number of survey tools out there but a favourite for many is www.surveymonkey.com
This is simple to use and up to 10 questions per survey are free. For most small businesses, this is enough anyway. Few customers have the patience to participate in long surveys.
When you signed up for this course, I asked you all to complete a registration, which was essentially a survey, which I created in Survey Monkey. I will also create a feedback survey for the end of the course. These provide me with valuable information, collected in a structured and efficient way, meaning I can continue to tailor and improve the course..
When creating surveys, a basic concept to understand is the type of questions you are going to ask. This table on Qualitative vs Quantitative will get you thinking of the type of data you might want to collect. Ultimately it depends on the number of responses you expect and how you are going to use the data. For myself, I only deal with a relatively small number of responses and read through them personally to analyse and like to hear people’s own thoughts and suggestions, so prefer qualitative. I also like short, sharp surveys as I don’t have much time to analyse data.
There are lots of creative ways you can use surveys. Within Facebook for example, and on some blogs ,there are very simple polls which you could try. I’ve used surveys such as this one prior to events to collect information and even lunch orders!
Professional Parents 2011 Business Brainstorming registration
Something you may like to consider is compiling a report on responses. Here is an example of a report following a survey on customers at the Women’s Health & Mother Baby Hub in Brisbane, Australia (where I used to work part time):
Women’s Health & Mother Baby Hub Survey Results
Reports such as these can be useful to decision makers but also of interest to customers.
So this has been a basic introduction to surveys but has aimed to give you some ideas to get started, love to hear how you go in a comment below!
If you get stuck using Survey Monkey, they have a great help section you can visit.
Statistics
You don’t have to be a numbers whiz to understand statistics. Even just basic information can be useful. It’s a great way to be able to measure your ROI (Return on Investment). Even though many social media tools are free, they do demand an even more previous commodity than money – your time.
Utilising statistics can range from casual observance right through to more formal methods. Firstly get clear on your social media goals (as per and then learn how to measure there. Here are a few ideas of where to go to find statistics for the social media tools we’ve discussed so far
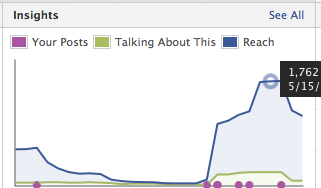
* Facebook business pages. Of course there is the number of “likers” as one of the most popular statistics but remember to check out your Insights section regularly. This will show up in the administration panel of your page. If you’re a new page, you will need a minimum number of likers before this appears – usually 30. As you can see from this recent screenshot, the reach increases dramatically on my page when I started posting regularly again after a bit of a break.
Click on the “see all” for more useful information. One of the statistics I find most useful is the demographics of the likers, along with their location.
* Twitter – I do not use Twitter as heavily and find just very basic stats there useful enough – my own tweets, following, followers – and I also check this out for anyone else I view. You can also look at mentions or watch trends on Twitter.
* Blogs/Websites –
This is one of my favourites – I monitor my website stats regularly and find the data both interesting and useful. The type of stats available will depend on your website, but I use WordPress for my sites and have installed the Jetpack statistics.
One unexpected stat on my Professional Parents website was my most popular post. I write there on things focussing around Work Family Balance. After my birthday a few years ago, friends asked for my easy Toblerone Cheesecake recipe, so I decided to try this out as a blog post. Not only was it popular with my friends, they shared it with theirs…and it continues to be one of my most visited posts! This tells me to experiment with different types of posts to see what people are interested in reading – and sharing.
* Google Analytics – is another very popular measurement tool for business. You can check out the Google Analytics website for information on whether it’s suitable for you.
So just 3 weeks to go to complete our 12 week social media school. Next week we’re discussing social media dashboards.
Renee
